In a constantly changing economy, and one that is increasingly reliant on specialized skills, workforce development has become an integral part of getting people good jobs and getting employers capable workers. “Workforce development” encompasses a wide range of activities by both public and private actors including education, training, social services, and more. On this platform, we focus on one essential piece in this puzzle: community colleges. This post will explain how to find data on workforce development and community colleges in the platform and highlight the important trends.
Getting to workforce development
Workforce development and community colleges are funded by the local and national governments, and information about them can be found in our Policy Tracker Dashboard.
To begin, look at all policy transfers to see how workforce development stacks up.

The dashboard will display maps and graphs of government spending data.
Exploring the data
Community colleges serve their communities at large, so they are included in place-based transfers (along with things like small business assistance and regional development). This distinguishes them from individual transfers like welfare and Social Security.
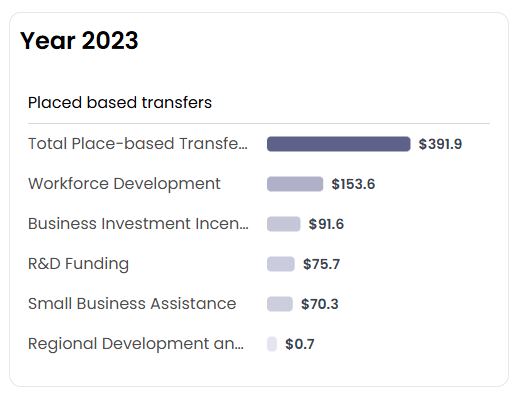
Two key facts come up right away: the first is that workforce development is the largest component of place-based transfers. At $153.6 per capita, it makes up more than a third of the total $391.9 per capita.
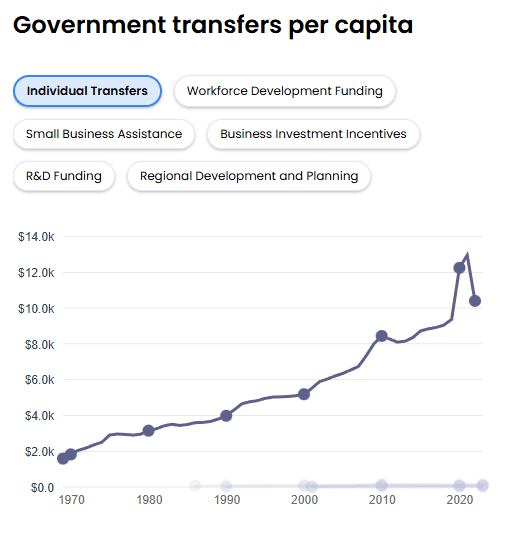
The second fact is that place-based transfers (including workforce development) are much less than individual transfers. Governments are spending almost 70 times as much on individual transfers as they are on workforce development.
To see what makes up the workforce development spending, select the “Workforce Development” tab at the top of the dashboard.

Then in "Step 2: Filter data" select "USD" from the "Unit Type" dropdown menu to see categories of spending in U.S. dollars (USD).

You can see that the two types of spending we include are state/local government funding (shown in grey) and federal funding (shown in blue) for community colleges. Breaking the spending down reveals that state and local governments account for most (in 2023, about three quarters) of community college funding. Looking over time, you can see that the general trend is upward. However, after the 2008 recession, federal funding went up, but state and local funding went down. State and local governments face stricter budget constraints, so hard economic times mean cutting spending. Since state and local governments make up most of the funding, the net effect is that in recent bad economic conditions, total spending on community colleges went down.
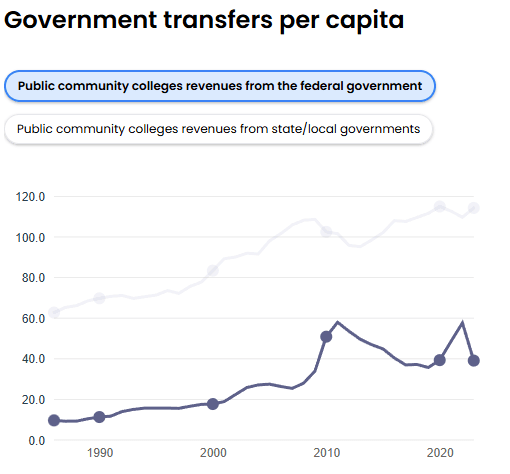 Per capita spending on community colleges - State/local spending (grey) and federal funding (blue)
Going over to the map, you can see there are no distinguishable geographic trends in community college spending. This is noteworthy as there are major geographic trends in economic conditions.
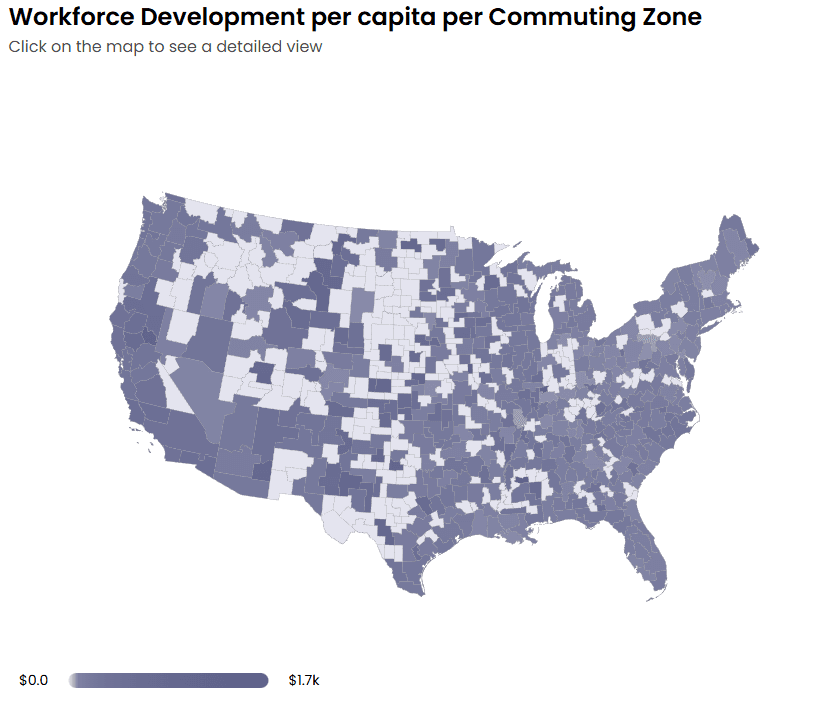 Per capita spending on community colleges - 2023
Takeaways
The general trend suggests that workforce development and community colleges are underutilized resources. For one thing, spending on community colleges is dwarfed by individual transfers. On top of that, the targeting of spending over time and across places is not very good. The decrease in spending during times of economic recession can exacerbate economic hardship; this is exactly when people are in the most need of jobs and job switching — the things that workforce development and community colleges are meant to facilitate. And there is no discernible connection between community college spending in different places and economic need. This means there is substantial opportunity to better use and target workforce development investments.